skip to main content

gaia data release 3 documentation

10.7 Eclipsing binaries

10.7.5 Quality assessment and validation

Verification

Figure 10.10: Folded light curves (after outlier removal) of a typical EA-type eclipsing binary with its G-band based two-Gaussian model. The G folded light curve is shown in the top panel. The GRP and GBP light curves, folded with the period recovered in the G band and shifted to a base magnitude equal to that in G, are shown in the bottom panel, in red for GRP and in blue for GBP. For illustration purposes, the two-Gaussian models shown in the top panel are displayed in the bottom panel too. The green areas highlight the estimated widths of the eclipses based on the Gaussian parameters.
Figure 10.11: Same as Figure 10.10, but for a typical EB-type eclipsing binary.
Figure 10.12: Same as Figure 10.10, but for a typical EW-type eclipsing binary.

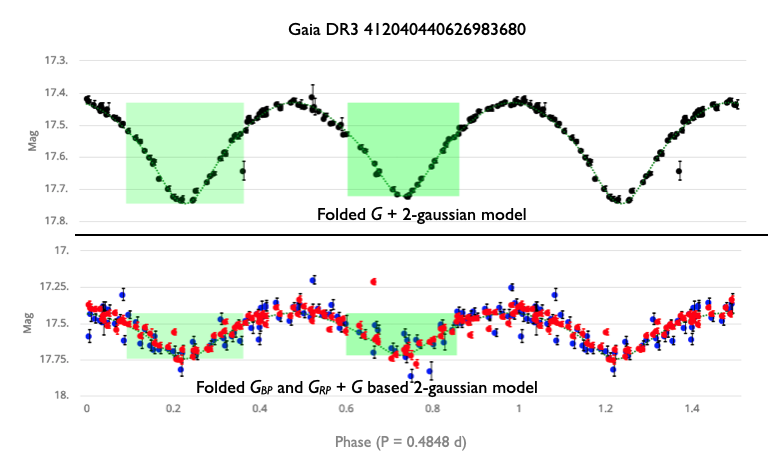
Three examples of EB folded light curves with their corresponding two-Gaussian models are shown in Figures 10.10 to 10.12, illustrating typical cases of EA-, EB-, and EW-type eclipsing binaries, respectively. The G-band folded light curves are shown in the top panel of each figure, while the GBP and GRP folded light curves are shown in the bottom panels with the G-band based model superimposed for illustration purposes.

Figure 10.13: Distribution of the global ranking of Gaia DR3 eclipsing binary candidates (in red) and of the subset therein cross-matched with known eclipsing binaries in the literature (in grey).

The distribution of the global ranking of all the Gaia DR3 eclipsing binaries is shown in Figure 10.13. For comparison, the distribution of the cross-matches of known EBs from the literature, which amount to nearly 528 000 sources, is also shown in the figure.

Figure 10.14: Observational Hertzsprung–Russell diagram of the 521 000 Gaia DR3 eclipsing binary candidates (in red) with relative parallax uncertainties better than 20 %. Cross-matches of 213 000 known eclipsing binaries in literature are shown in blue. The background points in grey represent the distribution of a random sample of about one million Gaia DR3 sources with parallax uncertainties better than 10 %.

The distribution in the observational Hertzsprung–Russell diagram of the 521 000 Gaia DR3 EBs with relative parallax uncertainties better than 20 % is displayed in red in Figure 10.14. It is consistent with the distribution of known eclipsing binaries from the literature, shown in blue in the figure.

Validation

Figure 10.15: Comparison of the Gaia DR3 EB candidate periods with those available in the literature. Left panel: The two period distributions colour-coded as indicated in the inset. Right panel: Gaia DR3 periods versus literature periods.
Figure 10.16: Distribution of the Gaia DR3 periods for the subsets of Gaia DR3 EB candidates that are classified as of EA-type (in blue), EB-type (in green), or EW-type (in grey) in the literature.

The validation of the EB periods published in Gaia DR3 can be estimated by their comparison with the periods found in the literature for the sub-sample of nearly 530 000 sources that have a cross-match with known EBs. In Figure 10.15, the left panel reveals a similar distribution between the Gaia DR3 periods and the literature ones. The right panel directly compares the Gaia DR3 periods with the periods published in the literature, showing that the majority of them are either similar (82 %) or within a factor of two (7 %) between one another. The period distributions of the subsets that are classified as EA-, EB- and EW-type in the literature are shown in Figure 10.16. As expected, EA-type binaries dominate the long-period range while EW-type binaries are mainly found at periods below one day.