14.2.7 Radial Velocity Spectra
Nearly one million radial velocity spectra are included in Gaia DR3. The sky distribution of these sources can be seen in Figure 17.41 (left panel). The distribution is not uniform, and there are some regions with larger density, coinciding with known external surveys, while other regions are practically empty. You can find a detailed explanation for the selection in Seabroke et al. (2022).
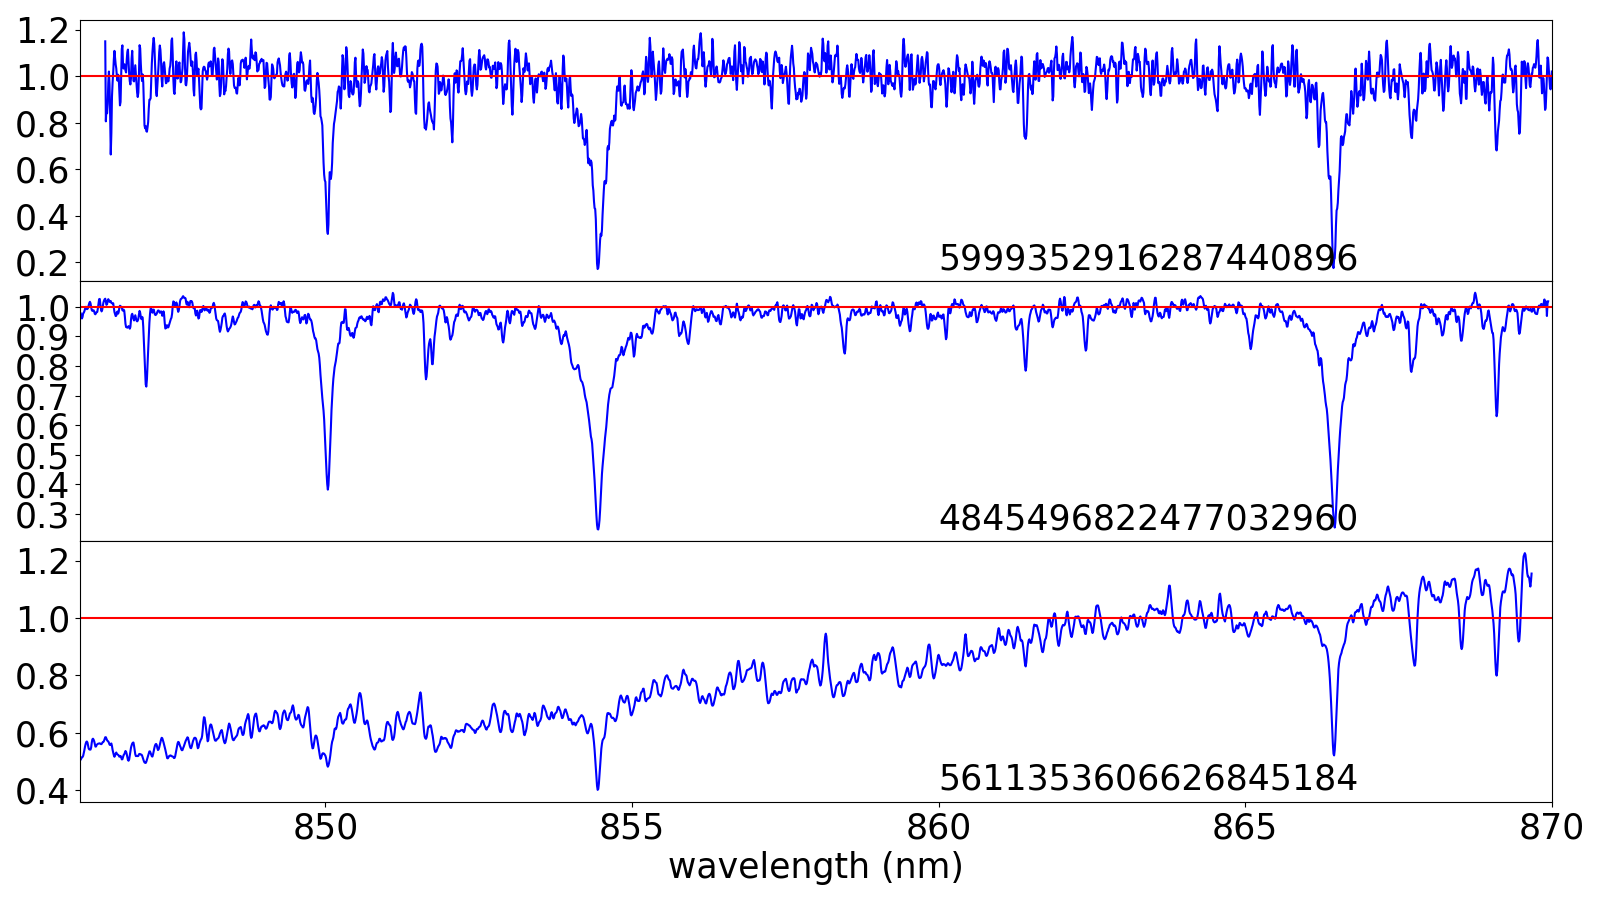
The continuum of the spectra has been established following different methods. Hence, when analysing the continuum level of the spectra, we can see three groups:
-
•
For faint targets, , (or rv_method_used=2), the method sets the median value of the flux at 1, which forces the continuum to be slightly above this value (see Figure 14.29-top).
-
•
For brighter targets (or rv_method_used=1), the continuum is slightly below 1 (see Figure 14.29-middle).
-
•
When the target is intrinsically red (when it uses a template with below 3500 K), the continuum is not flattened, resulting in a positive slope (see Figure 14.29-bottom).
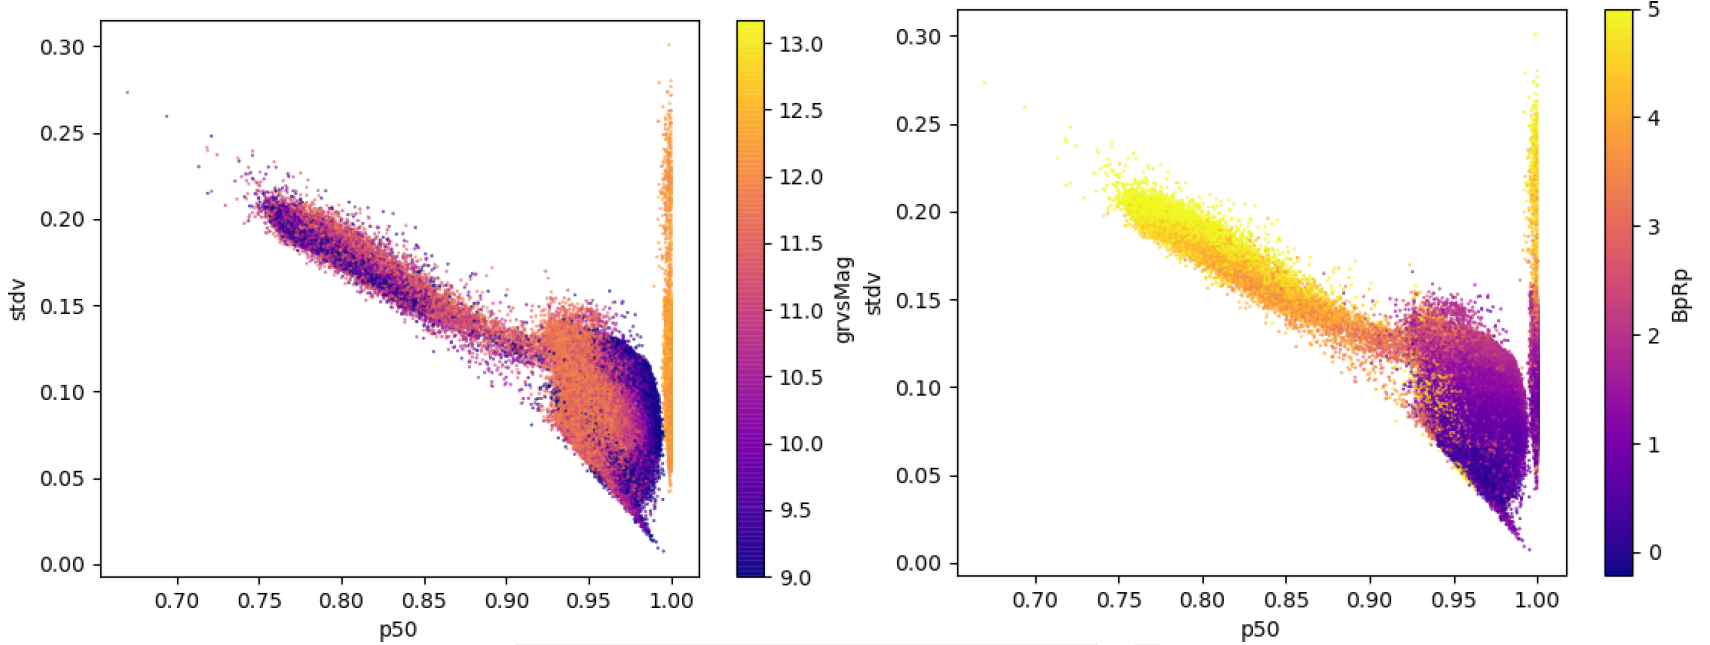
These three groups can also be seen in Figure 14.30.

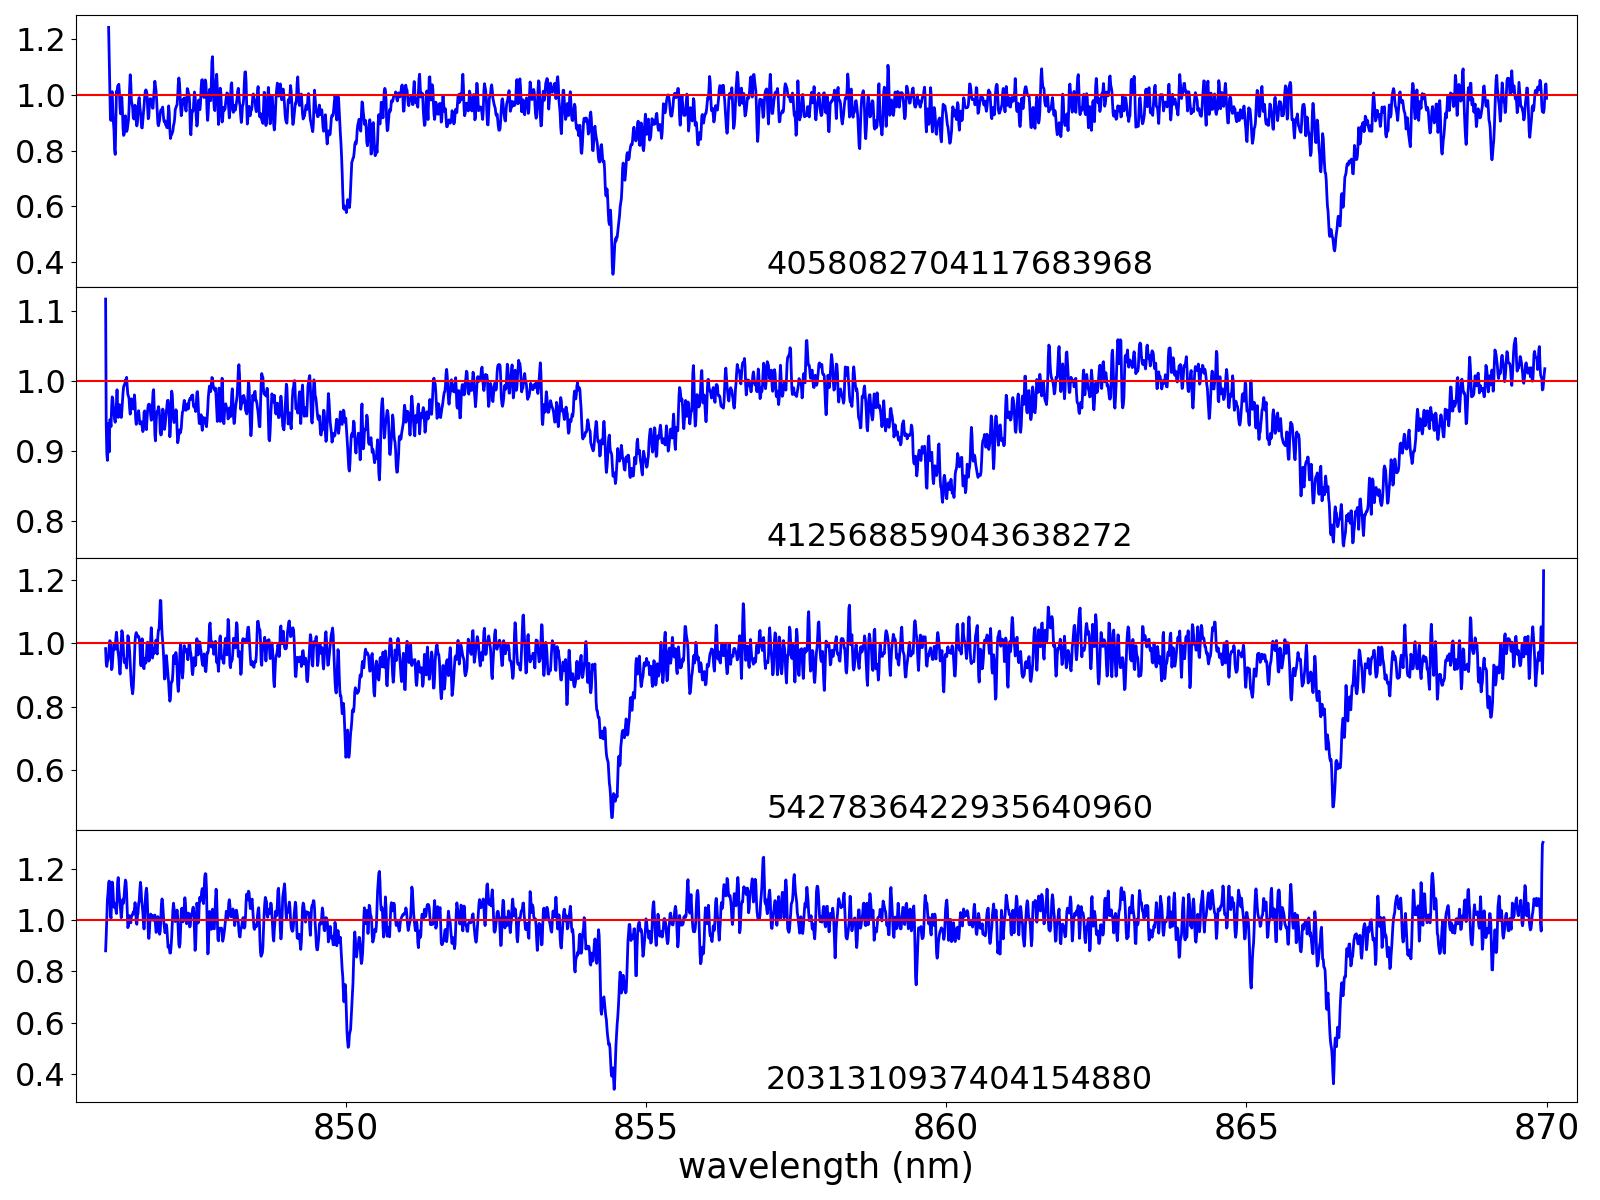
There are a few thousand spectra with small spikes at the edges. This is due to large noise at the edges that has not been completely removed. You can see four examples in Figure 14.31.