4.1 SSO data in GDR2
Author(s): Paolo Tanga, Alberto Cellino
The Gaia DR2 includes solar system object (SSO) observations collected during the nominal operations of Gaia, from 5 August 2014 to 23 May 2016. In principle, SSOs include different classes of objects. Following the nomenclature officially adopted by the International Astronomical Union (IAU) during the General Assembly in 2006, these classes are those of planets, dwarf-planets, satellites, and small solar system bodies.
In the case of Gaia observations, an a priori choice of targets was done, according to criteria explained in Section 4.2.1. The final list did not include planets nor satellites, nor, in general, any SSO brighter than Gmag 10. Among dwarf-planets, a few observed transits were selected for (136472) Makemake, only. The vast majority of SSOs selected for Gaia DR2 are therefore so-called small solar system bodies, including asteroids, comets and Trans-Neptunian objects (TNOs). Among them, comets are not present in Gaia DR2, and TNOs are extremely rare due to their apparent faintness that is normally beyond the magnitude limit for Gaia in all but a few cases. The bottom line is that SSOs detected by Gaia are nearly always asteroids, mostly main belt asteroids (see Section 4.2.1). For this reason, the two terms SSO and asteroid will be often used indifferently throughout this document, having the same meaning in all but a few practical cases.
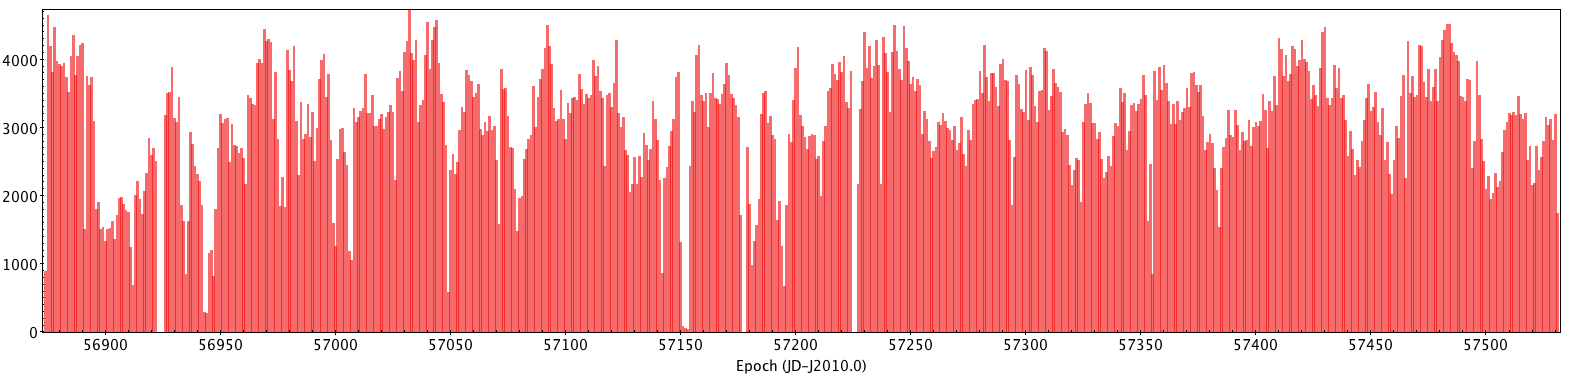
The Gaia DR2 SSO data set contains a total number of observations, namely measurements recorded by the single astrometric CCD detectors, equal to , corresponding to the transits of objects across the Gaia focal plane. The general distribution of the observations over the period is rather homogeneous in time, with exceptional gaps, in general shorter than a few hours, due to maintenance operations (station keeping manoeuvres, telescope refocusing, micro-meteoroid hits and other events) and is illustrated in Figure 4.1.
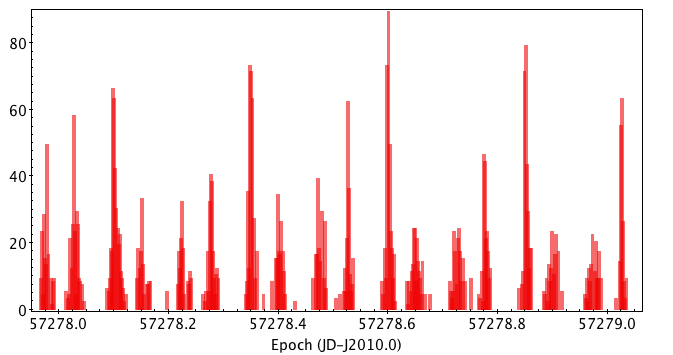
A more detailed view of the distribution with a resolution of several minutes (Figure 4.2) reveals a general pattern due to the rotation of the satellite (6 hours) and dominated by a sequence of peaks that correspond to the crossing of the ecliptic region by the two fields of view, at intervals of 106 minutes (FOV 1 to FOV 2) and 254 minutes (FOV 2 to FOV 1). The peaks are strongly modulated in amplitude by the evolving geometry of the scan plane with respect to the ecliptic. For a general introduction to Gaia operations, see Gaia Collaboration et al. (2016).
During the first part of the period covered by the observations until 21 August 2014, a special scanning mode was adopted to obtain a dense coverage of the ecliptic poles (the ”Ecliptic Pole Scanning Law”, EPSL). In this peculiar geometry of the EPSL, the scan plane was nearly perpendicular to the ecliptic, with a gradual drift of the longitude of the node at the rate of the Earth revolution.
A smooth transitions then occurred towards the ”Nominal Scanning Law”, that has been maintained constant for the rest of the mission. In this configuration, the spin axis of Gaia precesses on a cone having the axis in the direction of the Sun and an aperture of 45 , over a period of 63 days. As a result, the scanning plane varies its inclination with respect to the ecliptic between 90 to 45 , and its nodal direction has a Solar elongation between 45 to 135 .
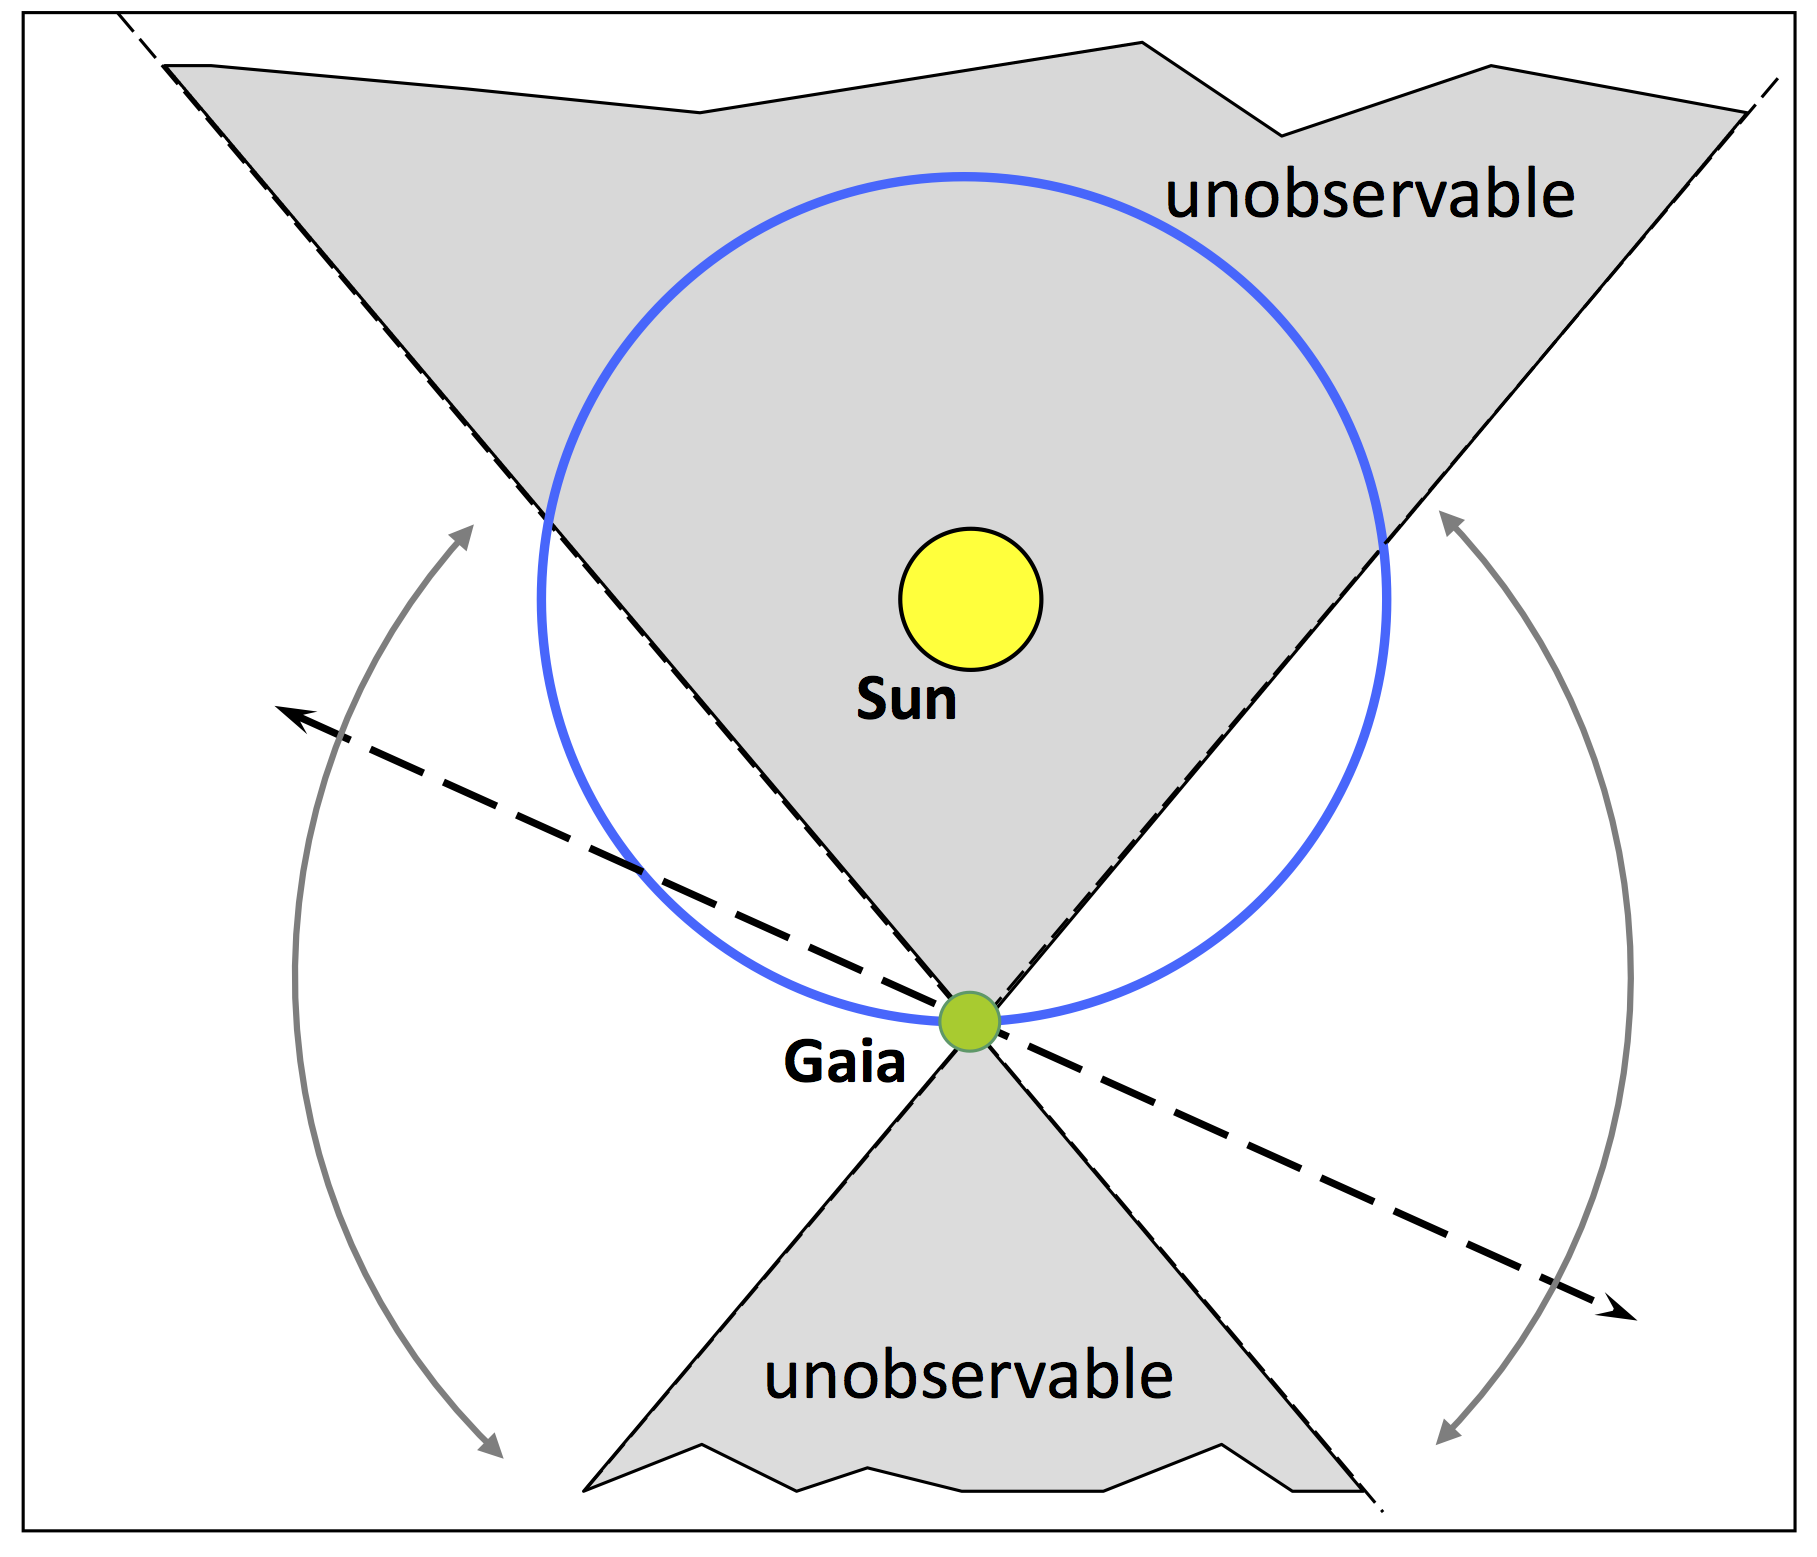
By considering the intersection of the scan plane with the ecliptic, as shown in Figure 4.3, it becomes clear that asteroids are never observed at less than 45 elongation both from the Sun and from the anti–solar direction (opposition).
The specific geometry of observation has important consequences on SSO observations. In fact, not only main belt asteroids are observed at non negligible phase angle, but also in a variety of configurations (high/low proper motion, closer of larger distance, etc.), that have some influence on many scientific applications, and can affect the detection capabilities of Gaia and the accuracy of the measurements.
As extensively explained in Gaia Collaboration et al. (2016), the satellite rotates at a constant rate, and the images of the sources on the focal plane drift continuously (in the ”Along Scan” direction, AL) across several CCD strips. A total of 9 CCD strips are crossed in the Astrometric Field (AF, numbered from 1 to 9). All SSO observations published in Gaia DR2, both for astrometry and for photometry, are solely based on AF measurements. Each CCD tracks the motion of the image by a Time Delay Integration (TDI) mode, at a rate corresponding to the drift induced by the satellite rotation. The TDI rate is calibrated on the stars and the exposure time is determined by the crossing time of a single CCD, namely 4.4 s. Lower exposure times are obtained when needed to avoid saturation, by intermediate read-out registers (the so-called ”gates”) that are activated at different thresholds when bright sources are detected.
To drastically reduce the data volume processed onboard and transmitted to the ground, only small patches around each source (”windows”) are read-out from the CCDs. For the vast majority of the detected sources (apparent magnitude ) the window has a size of 1212 pixels, but the pixel value is integrated in the AC direction. Only a one-dimensional information, in the AL direction, is thus available, with the exception of the brightest sources ( ) for which a full 2D window is transmitted. Sources of intermediate brightness are given a slightly larger window (1812) but AC binning is always present.
As the TDI rate corresponds to the nominal drift velocity of stars on the focal plane, the image of an SSO, due to its apparent motion with respect to the stars, will generally exhibit a spreading in the direction of its motion. Moreover, it will progressively move away from the window centre during the transit, with a more or less relevant flux loss. For instance, the signal of an asteroid with an apparent motion (in the AL direction) of 13.6 mas/s, will move of one pixel during a single CCD crossing, with a corresponding image smearing. The central peak of its signal will reach the edge of a 12 pixel–wide window while travelling from AF1 to AF5. In practice, the accurate determination of the position of the source within the window will be affected by an increasingly larger uncertainty over the transit, and become unusable from AF5/6 to AF9. This is thoroughly explained in Section 4.4.3.
The orientation of the scanning plane of Gaia is most of the time not far from being perpendicular to the ecliptic plane. In this specific orientation, asteroids having low–inclination orbits move mainly in AC direction. As the AC pixel size is 3 times larger than AL, the effects of motion are strongly reduced. However, during the precession cycle the scan plane reaches inclinations down to 45 with respect to the ecliptic. These variations in orientation, coupled with the distribution of the inclinations of asteroid orbits, translate into a large range of possible orientations of the velocity vector on the (AC, AL) plane. For any object, each transit on the focal plane, occurring at a different epoch and position on the sky, is a unique event, associated to a non-repeatable relative geometry of velocity and scan direction.
The apparent displacement of a SSOs at the epoch of each observation is clearly a major factor affecting the performance of Gaia at each transit. Other effects acting on single CCD observations exist, such as local CCD defects, local PSF deviations, cosmic rays, background sources, etc. For all these reasons, the exploitation of the single data points must rely on a careful analysis, taking into account both the geometric conditions of the observations and appropriate error models.
A direct consequence of the observation strategy employed by Gaia, is the very peculiar error distribution for each single astrometric observation. In most cases, due to AC binning, very accurate astrometry in the Astrometric Field is available only in the AL direction. Of course this is a natural consequence of the overall mission design, aimed at converting an accurate measurement of time (the epoch when a source image crosses a reference line on the focal plane) into a position. The AC information thus remains approximate due mostly to binning, but also to attitude uncertainties and to the lower resolution of the telescope in the AC direction. In practical terms, the astrometry is reduced to a single dimension (AL).
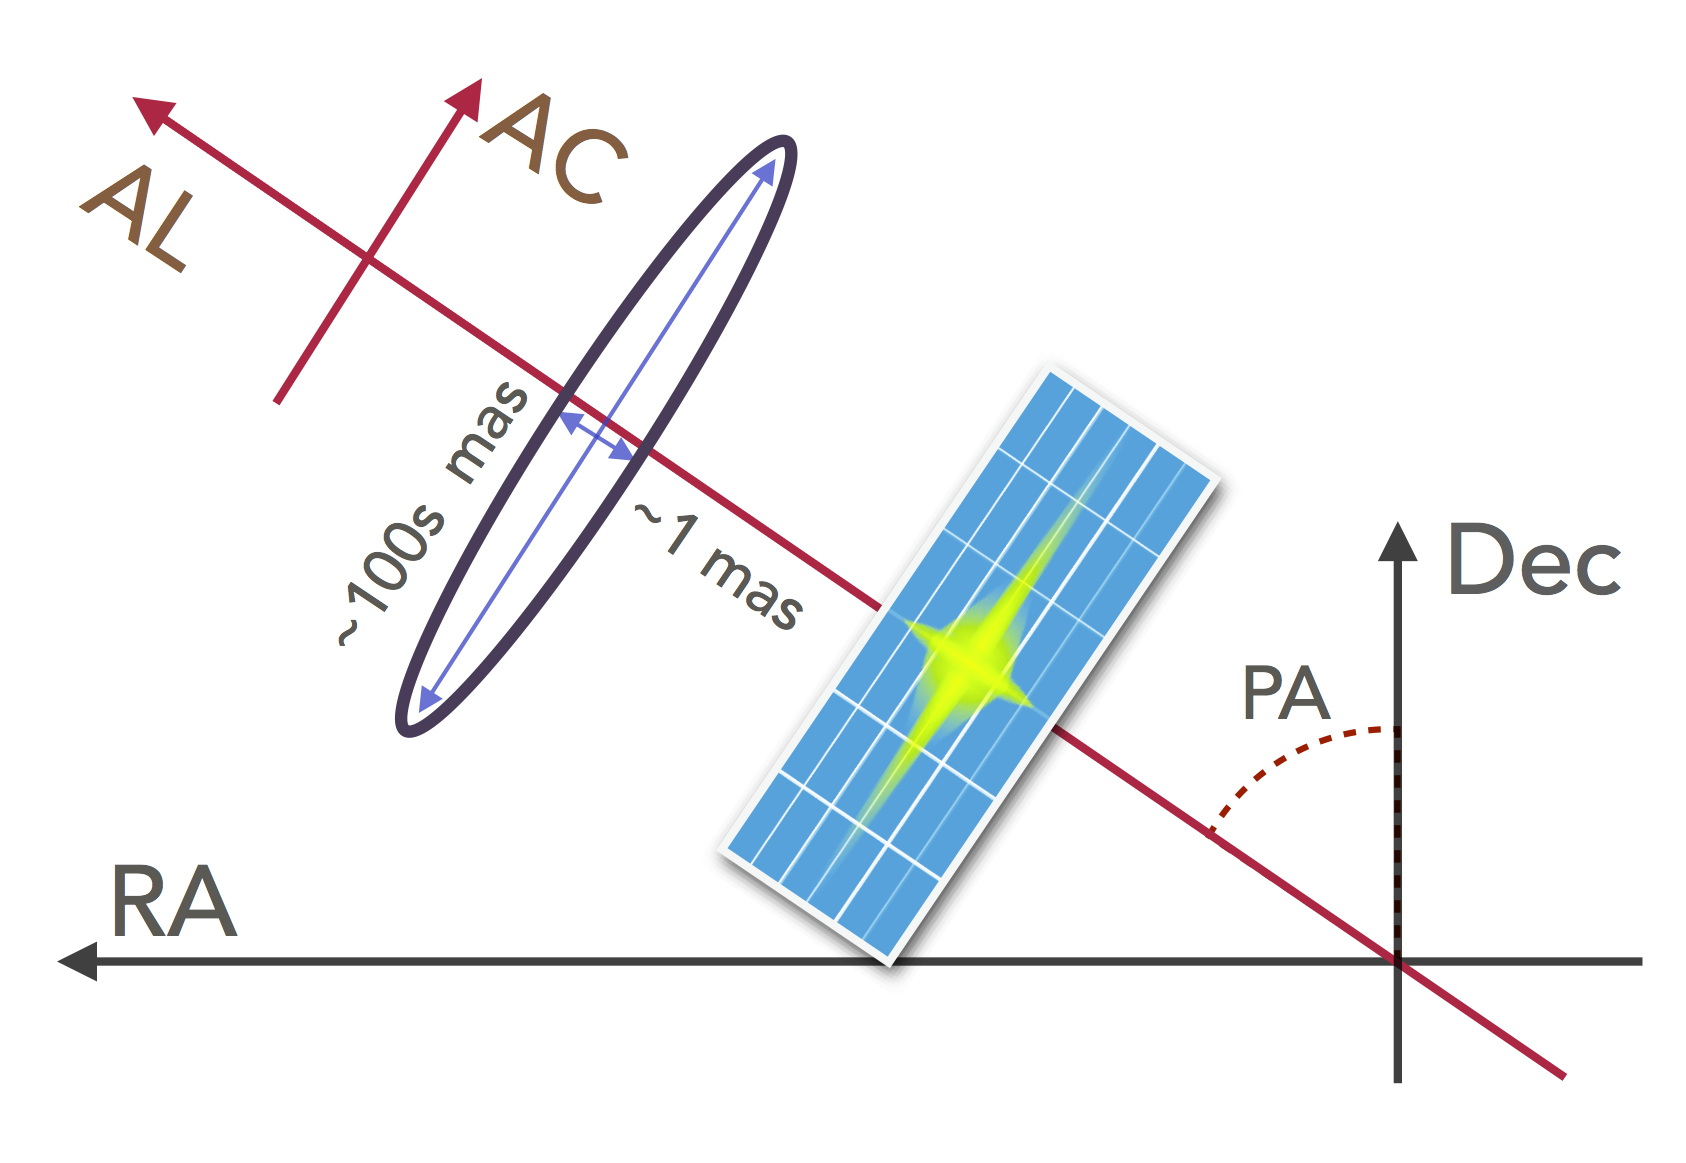
As illustrated in Figure 4.4, the resulting uncertainty on the position can be represented by an ellipse extremely stretched in the AC direction. When such position is converted into another coordinate frame (such as the equatorial reference RA, Dec) a very large correlation appears between the related uncertainties . Taking into account such correlation is essential to exploit the full accuracy of Gaia astrometry. The data processing pipeline has been designed in such a way as to take into account this peculiarity, to provide in output the uncertainties and their correlations.
The data processing for SSOs is illustrated by the scheme in Figure 4.5. The pipeline works on the base of a predetermined list of transits of SSOs in the FOVs of Gaia. A list of accurate predictions has been therefore created as a first step, by matching the evolving position of each known object to the sky path of the Gaia FOVs. The predictions of SSO transits have then been matched to the observed transits (provided by the Initial Data Treatment (IDT) output, see Gaia Collaboration et al. (2016)).
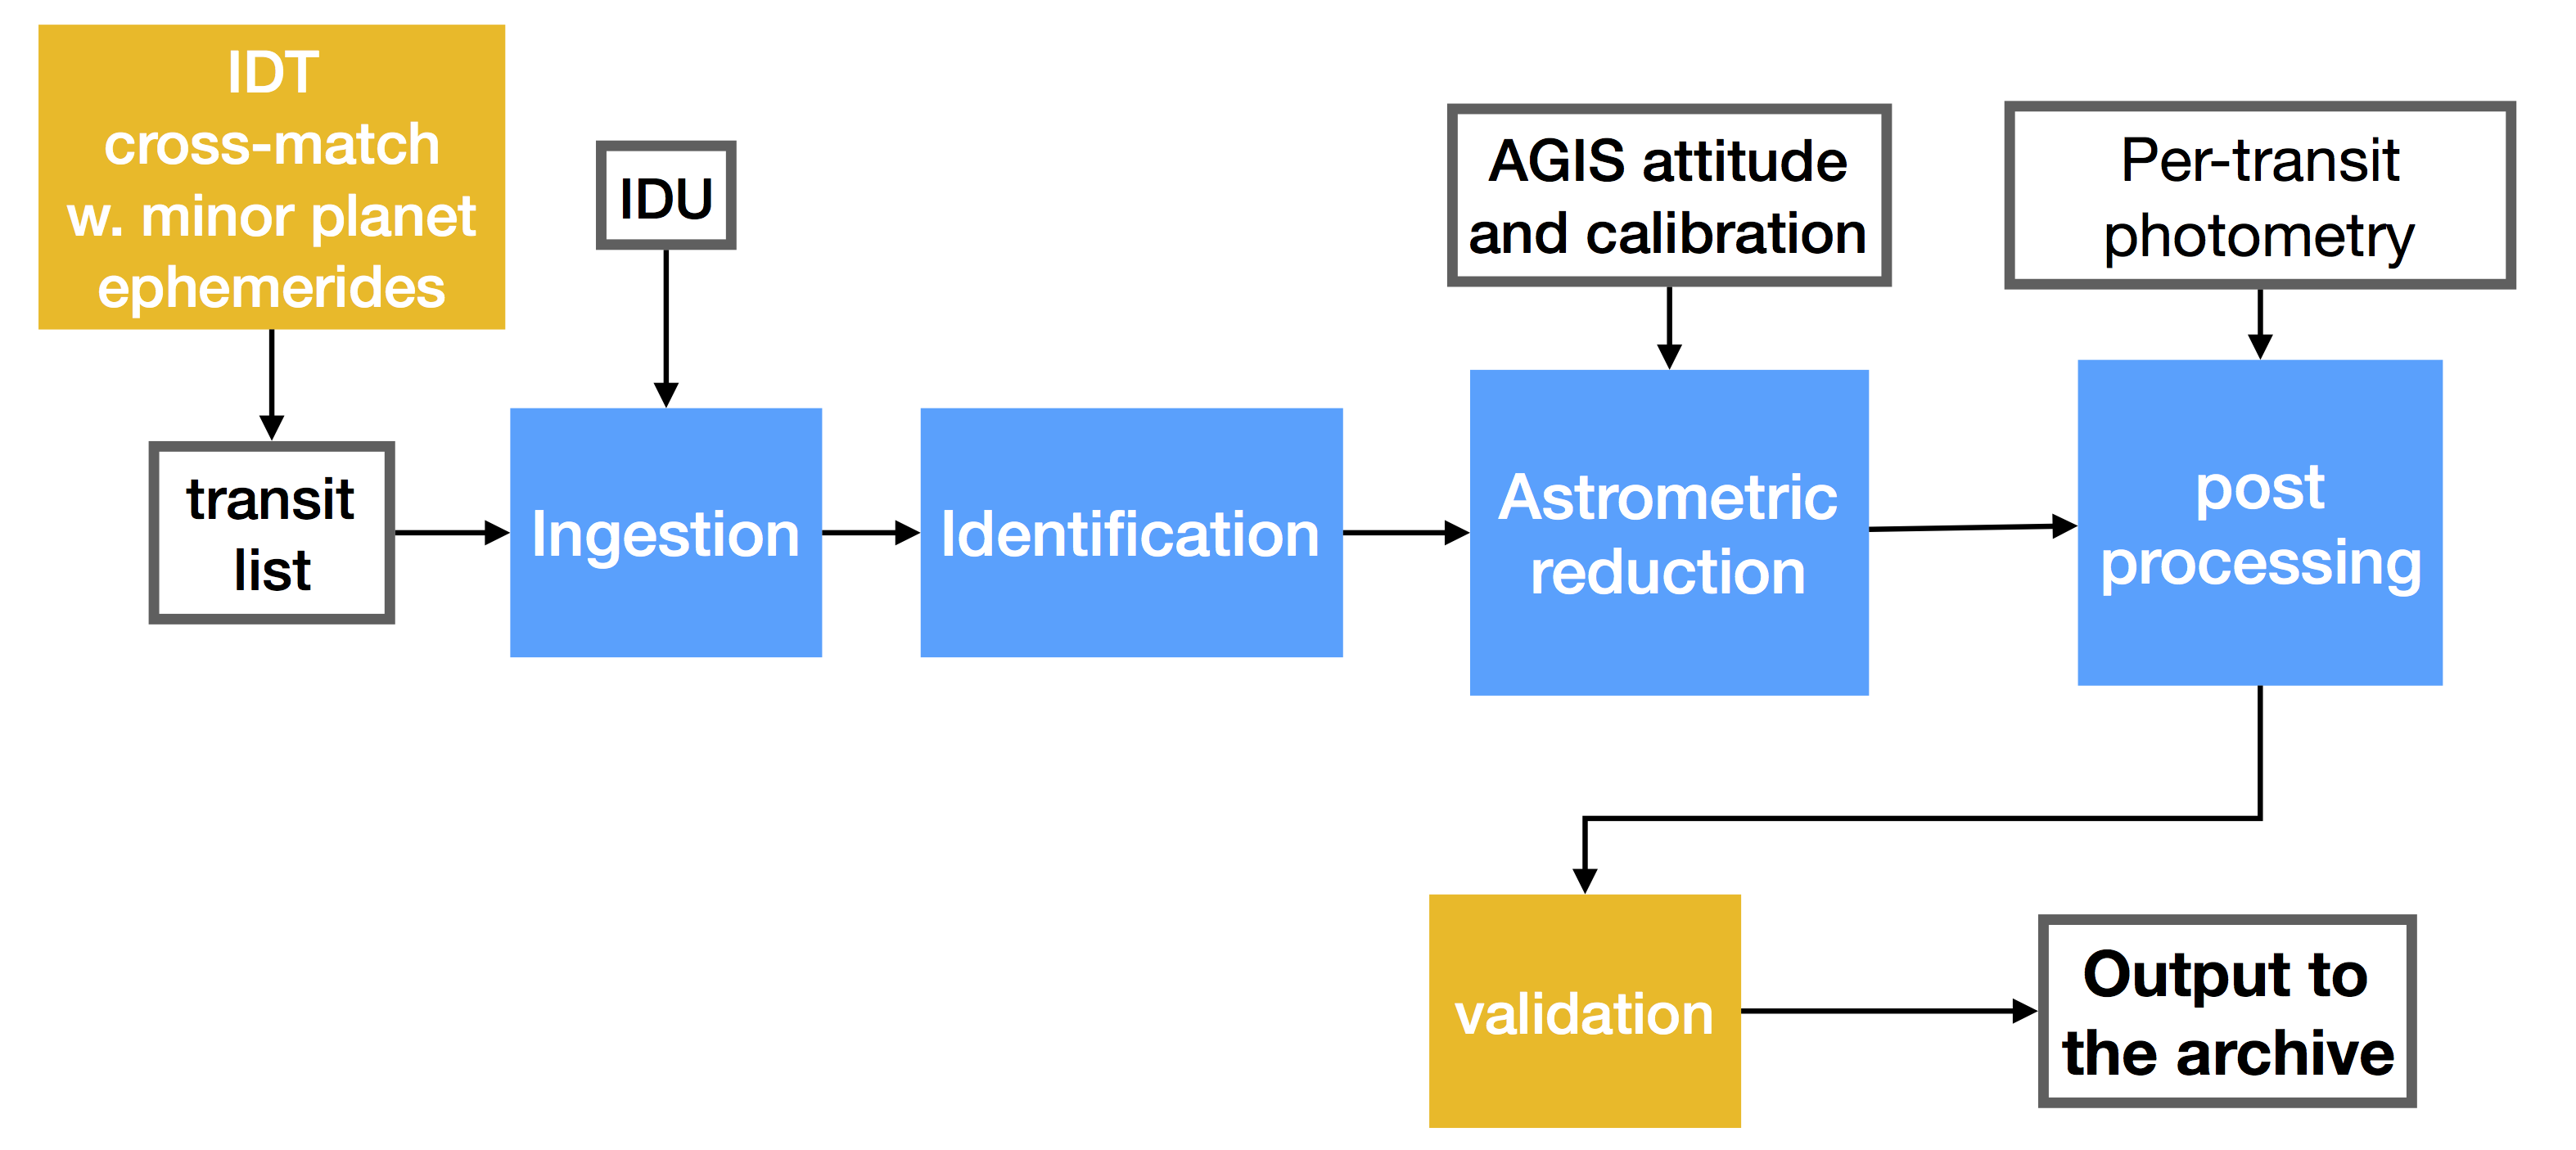
The core of the pipeline collects all the data needed to process the identified transits (epoch of transit on each CCD, flux, AC window coordinates, and other auxiliary information). A first module, labelled ”Identification” in the scheme, is in charge of computing auxiliary data for each SSO, and to assign a correct label identifying the object. Focal plane coordinates are then converted to sky reference by using the global solution provided by AGIS and the corresponding calibrations (”Astrometric reduction” module). Post-processing adds then calibrated photometry, determined by an independent pipeline (see Chapter 5) to the data of each observation, and groups all the observed transits of a same target. Eventually, some specific validation procedures perform the task of rejecting anomalous data. The details of all the developed procedures are explained in the next Sections.