10.2 Internal comparisons
Author(s): Claus Fabricius, Frédéric Arenou, Teresa Antoja, Carme Jordi, Nicolas Leclerc, Mercè Romero-Gómez, Sergio Soria
We describe in the following a number of internal properties and comparisons of the Gaia DR2 catalogue. The main points of the validation are already described in Arenou et al. (2018), and we here merely provide complementary information and examples.
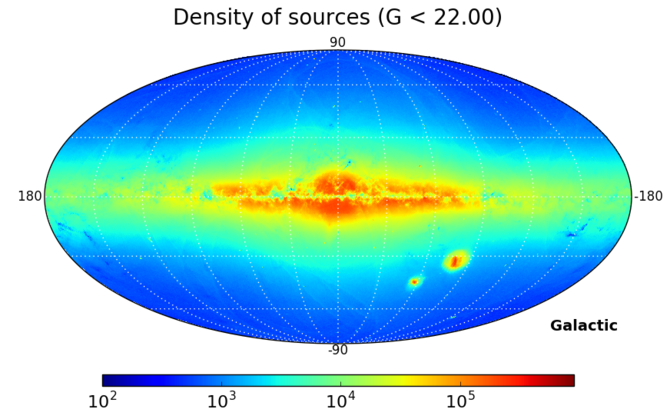
The general distribution of sources is illustrated Figure 10.1. As opposed to Gaia DR1, very few artefacts can be seen. A number of regions of high absorption are of course visible, but also large areas at higher latitudes with artificial changes in the source density and clearly less sources than in neighbouring areas. These deficient regions suffer from a lower number of scans and a better coverage can be expected in the future.
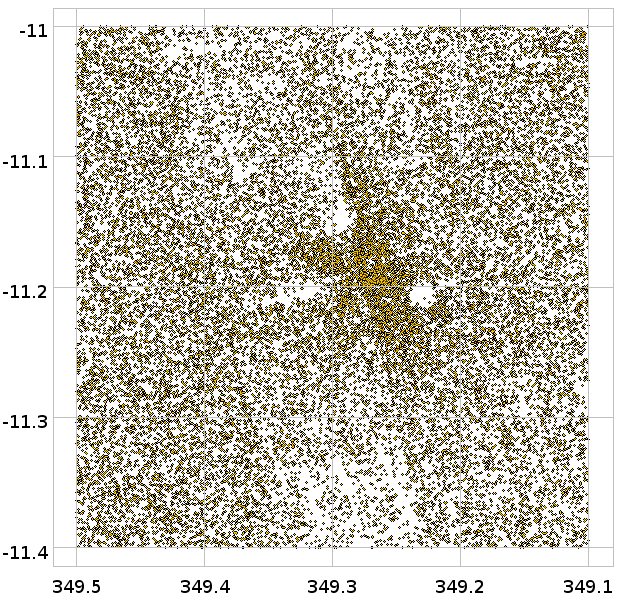
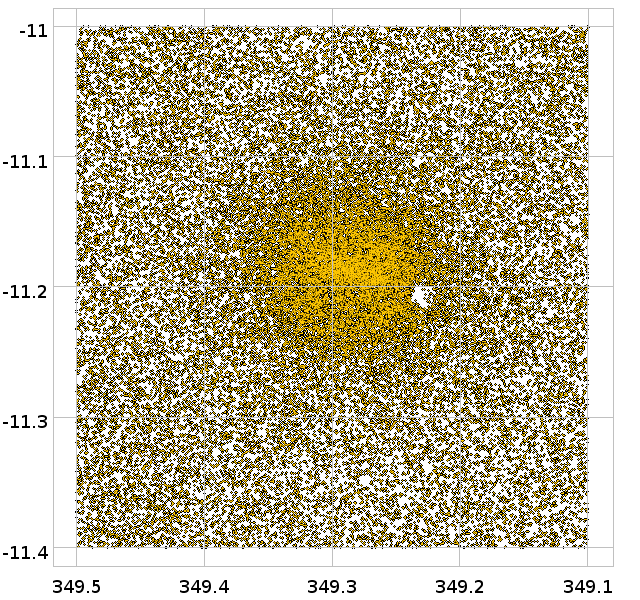
In Gaia DR1 dense areas suffered a non-uniform coverage, especially in certain regions centred on the ecliptic, e.g. the area around the Galactic centre. As can be seen Figure 10.2, showing the globular cluster NGC 6541, the coverage has improved significantly in Gaia DR2, but some holes still remain to be filled.
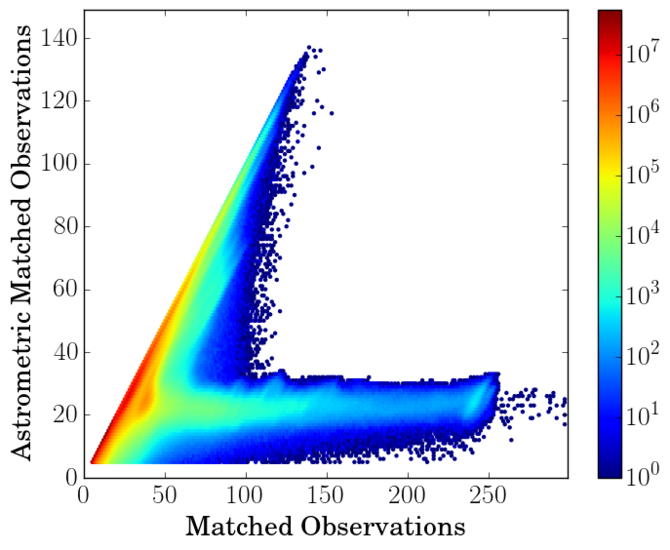
A feature that may seem surprising is illustrated Figure 10.3, where we can see that the number of transits used in the astrometric solution can be significantly lower than the total number of transits available. This is due to the elimination of the first month of data from the astrometry. During that month Gaia was scanning perpendicularly to the ecliptic, and the polar regions, including the LMC, got therefore a large number of transits. In these areas the number of photometric observations may therefore be significantly larger than the number of astrometric observations.